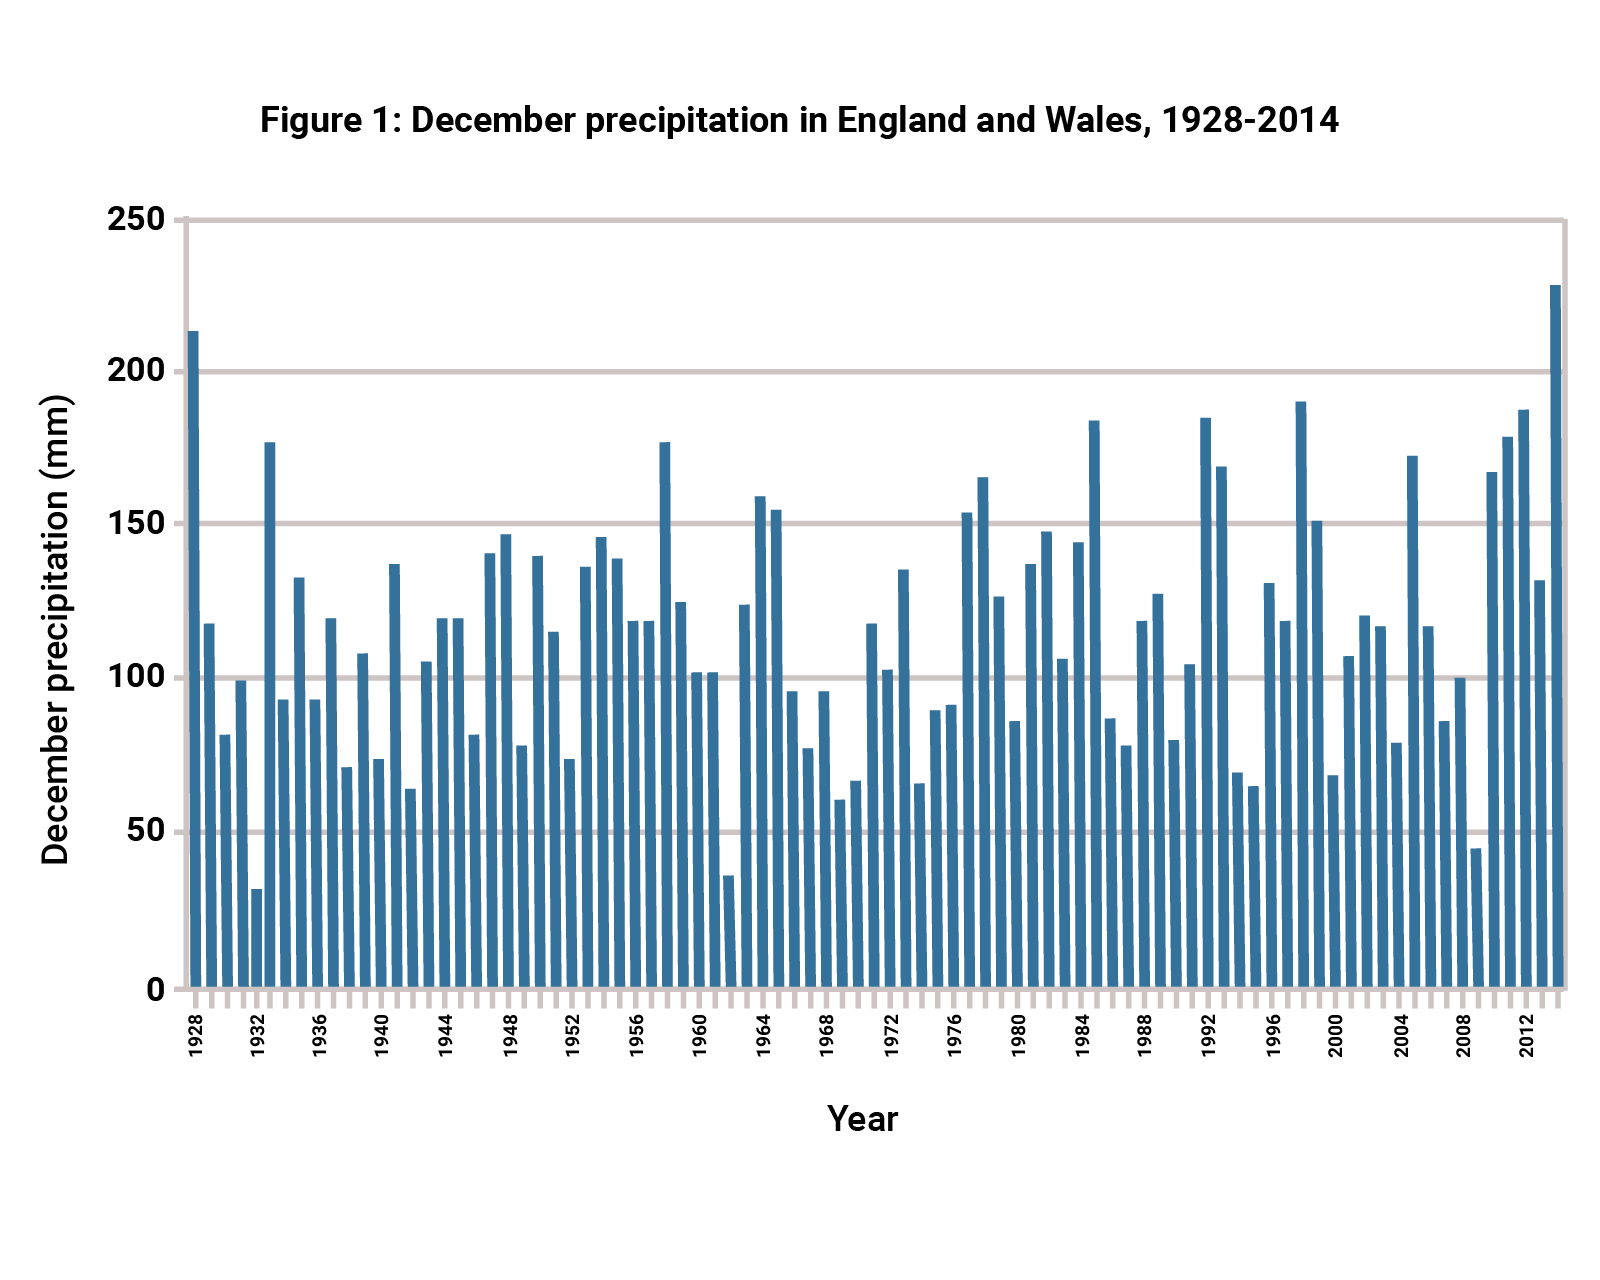
What’s the story?

Select the three analytical statements below which, when combined, best summarise this graph’s overall ‘story’.
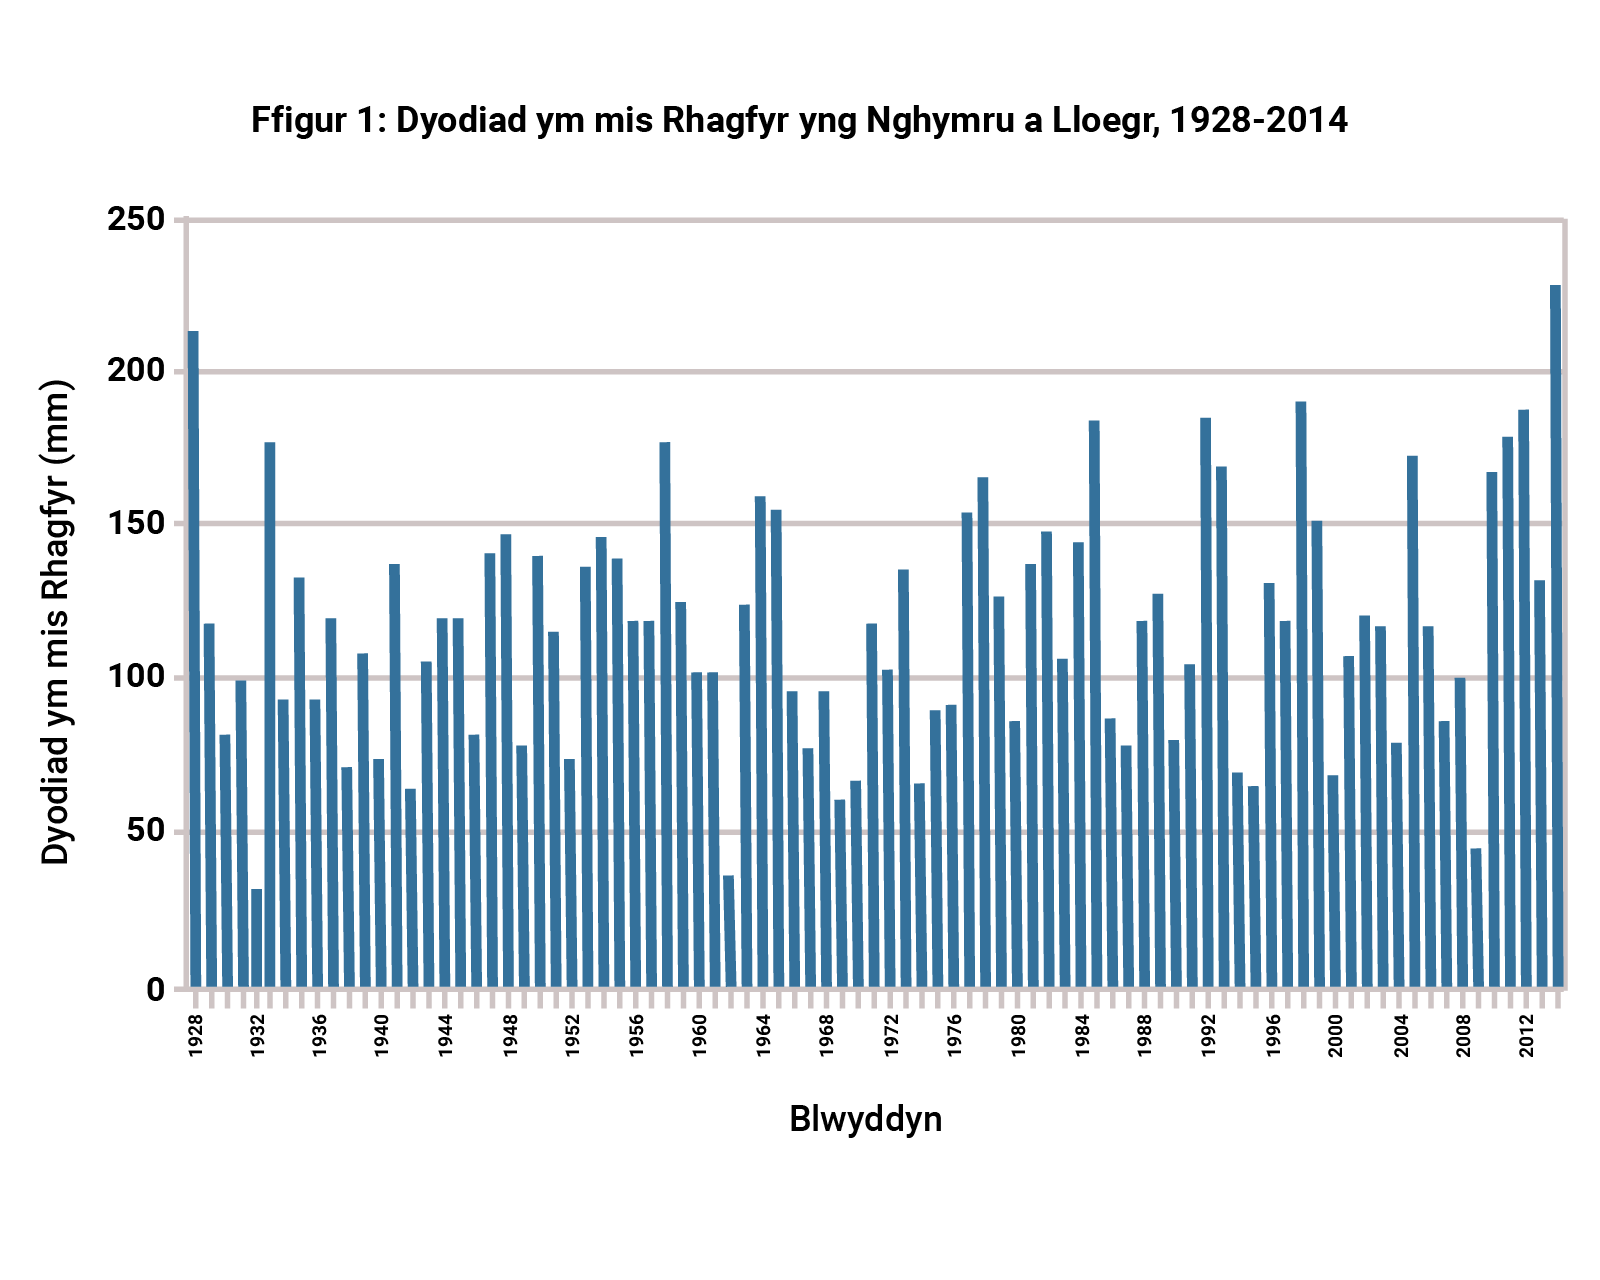
Beth yw'r stori?

Dewiswch y tri datganiad dadansoddol isod sydd, gyda'i gilydd, yn rhoi'r crynodeb gorau o 'stori' gyffredinol y graff hwn.

Figure 1: December precipitation in England and Wales, 1928-2014
Figure 1: Met Office / WJEC CBAC Ltd. https://bit.ly/34wdCZ5
Ffigur 1: Dyodiad ym mis Rhagfyr yng Nghymru a Lloegr, 1928-2014
Ffigur 1: Met Office / WJEC CBAC Ltd. https://bit.ly/34wdCZ5

Quantitative skills check

Study the data shown in the graph then answer the questions.

Gwirio sgiliau meintiol

Astudiwch y data a ddangosir yn y graff ac atebwch y cwestiynau.

Figure 1: December precipitation in England and Wales, 1928-2014
Figure 1: Met Office / WJEC CBAC Ltd. https://bit.ly/34wdCZ5
Ffigur 1: Dyodiad ym mis Rhagfyr yng Nghymru a Lloegr, 1928-2014
Ffigur 1: Met Office / WJEC CBAC Ltd. https://bit.ly/34wdCZ5
QuestionCwestiwn Your AnswerEich Ateb Correct AnswerAteb Cywir

Answer:

Ateb:

Identifying the elements of a good AO3 response

Read the two responses to the following 5-mark AO3 question

Use the graph to analyse long-term changes in December precipitation in England and Wales.

Decide which is the best response.

After discussing the strengths and weaknesses of each answer, click to reveal an examiner commentary.

Nodi elfennau ymateb AA3 da

Darllenwch y ddau ymateb i'r cwestiwn AA3 canlynol sy'n werth 5 marc

Defnyddiwch y graff i ddadansoddi newidiadau hirdymor yn y dyodiad ym mis Rhagfyr yng Nghymru a Lloegr.

Penderfynwch pa ymateb yw'r un gorau.

Ar ôl trafod cryfderau a gwendidau pob ateb, cliciwch i ddatgelu sylwadau'r arholwr.

Figure 1: December precipitation in England and Wales, 1928-2014
Figure 1: Met Office / WJEC CBAC Ltd. https://bit.ly/34wdCZ5
Ffigur 1: Dyodiad ym mis Rhagfyr yng Nghymru a Lloegr, 1928-2014
Ffigur 1: Met Office / WJEC CBAC Ltd. https://bit.ly/34wdCZ5

Response A

Overall the trend is unclear and there seems to be no permanent change. The maximum value is about 230 mm in 2014 and the lowest was 30 mm in 1932. There are many other highs and lows meaning that there is no long-term trend that I can see. For example, there is a low amount in 1962. There is a high amount of precipitation in 1958.

Ymateb A

Yn gyffredinol, nid yw'r duedd yn glir ac ymddengys nad oes unrhyw newid parhaol. Y gwerth mwyaf oedd tua 230mm yn 2014 a'r gwerth lleiaf oedd 30mm yn 1932. Mae llawer o werthoedd uchel ac isel eraill sy'n golygu na allaf weld unrhyw duedd hirdymor. Er enghraifft, mae swm isel yn 1962. Mae llawer iawn o ddyodiad yn 1958.

Examiner Commentary Response A

Although this answer correctly identifies the maximum and minimum, it is a shame that no effort is made to analyse the trend in high values (above 150mm) and acknowledge there is possible evidence of an increase. Overall, this is a poor answer to the question asked.

Sylwadau'r arholwr - Ymateb A

Er bod yr ateb hwn yn nodi'r gwerthoedd uchaf ac isaf yn gywir, mae'n bechod na wnaed unrhyw ymdrech i ddadansoddi'r duedd mewn gwerthoedd uchel (uwchlaw 150mm) a chydnabod bod tystiolaeth bosibl o gynnydd. Ar y cyfan, mae hwn yn ateb gwael i'r cwestiwn a ofynnwyd.

Response B

It is possible that December precipitation has increased slightly in recent decades. The value has exceeded 150 mm 11 times since 1976 but only 5 times before then. This could indicate a long-term trend towards higher precipitation. 2014 had the highest precipitation for the entire period (230mm). However things are made complicated by what could be a cycle (every 3-5 years) of an unusually low amount of precipitation in some years, most recently in 2009 (48mm). Moreover, very high values were recorded in the past in 1928 and 1933. Therefore while there is some evidence of a long-term increase, it is far from certain that a significant change is happening.

Ymateb B

Mae'n bosibl bod y dyodiad a welir ym mis Rhagfyr wedi cynyddu ychydig yn ystod y degawdau diwethaf. Mae'r gwerth wedi bod yn fwy na 150mm 11 o weithiau ers 1976 ond dim ond 5 gwaith cyn hynny. Gallai hyn nodi tuedd hirdymor tuag at fwy o ddyodiad. Cafwyd y dyodiad mwyaf ar gyfer y cyfnod i gyd yn 2014 (230mm). Fodd bynnag, mae pethau'n cael eu cymhlethu gan yr hyn a allai fod yn gylch (bob 3-5 mlynedd) o ddyodiad anarferol o isel mewn rhai blynyddoedd, y mwyaf diweddar yn 2009 (48mm). Hefyd, cofnodwyd gwerthoedd uchel iawn yn y gorffennol yn 1928 a 1933. Felly, er bod rhywfaint o dystiolaeth o gynnydd hirdymor, nid oes sicrwydd o bell ffordd bod newid sylweddol yn digwydd.

Examiner Commentary Response B

This is an excellent answer which uses the data to analyse possible evidence for a long-term change. Part of the challenge of this question is thinking critically about the strength of the evidence shown. This answer acknowledges that while there may be a possible trend, it is far from being compelling evidence. In contrast, Response A dismissed any possibility out of hand without offering a detailed analysis of the data. Response B also analyses the evidence for cyclical trends, or cycles, of higher and lower precipitation - good!

Sylwadau'r arholwr - Ymateb B

Mae hwn yn ateb ardderchog sy'n defnyddio'r data i ddadansoddi tystiolaeth bosibl o newid hirdymor. Rhan o her y cwestiwn hwn yw meddwl yn feirniadol am gryfder y dystiolaeth a ddangosir. Mae'r ateb hwn yn cydnabod, er bod yna duedd o bosibl, fod y dystiolaeth ymhell o fod yn gymhellol. I'r gwrthwyneb, gwrthododd Ymateb A unrhyw bosibilrwydd ar unwaith heb gynnig dadansoddiad manwl o'r data. Mae Ymateb B hefyd yn dadansoddi'r dystiolaeth ar gyfer tueddiadau cylchol, neu gylchoedd, o ddyodiad uwch ac is - da!

Analysing data concisely

A student has given a response to the question below, which has a tariff of just 3 marks. Their answer is excessively long. Your task is to edit the response so that it becomes as short and succinct as possible while still gaining the full three point marks.

When you have edited the text, add ticks where you think the 3 marks should be awarded.

Use the graph to describe changes in December precipitation in England and Wales between 1928 and 1962. [AO3, 3 marks]

Dadansoddi data yn gryno

Mae myfyriwr wedi rhoi ymateb i'r cwestiwn isod, sy'n werth 3 marc yn unig. Mae ei ateb yn rhy hir. Eich tasg chi yw golygu'r ymateb er mwyn sicrhau ei fod mor fyr a chryno â phosibl, gan sicrhau eich bod yn ennill y tri marc llawn ar yr un pryd.

Pan fyddwch wedi golygu'r testun, ychwanegwch diciau wrth ochr y mannau lle y credwch y dylai'r 3 marc gael eu rhoi.

Defnyddiwch y graff i ddisgrifio newidiadau mewn dyodiad ym mis Rhagfyr yng Nghymru a Lloegr rhwng 1928 a 1962. [AA3, 3 marc]

Figure 1: December precipitation in England and Wales, 1928-2014
Figure 1: Met Office / WJEC CBAC Ltd. https://bit.ly/34wdCZ5
Ffigur 1: Dyodiad ym mis Rhagfyr yng Nghymru a Lloegr, 1928-2014
Ffigur 1: Met Office / WJEC CBAC Ltd. https://bit.ly/34wdCZ5
The maximum precipitation of 215mm is in the very first year, 1928. After this, there is no particular trend and it fluctuates from year to year. For example, right after 1928 it falls to a very low level in 1932 before bouncing up again in 1933 to about 180 mm. Overall, precipitation keeps fluctuating with no real pattern, staying above 60mm but below 150mm in all but five years. It just keeps rising and falling every year with no particular trend apart from the 1950s when it stays above 100mm every year between 1953 and 1959. But in the final year, 1962, it drops to a new minimum of about 35mm. This is slightly higher than another low year which had occurred in 1932.

Suggested response

The maximum precipitation of 215mm is in the very first year, 1928.✔[1 mark] Overall, precipitation keeps fluctuating with no real pattern, staying above 60mm but below 150mm in all but five years.✔[1 mark] But in the final year, 1962, it drops to a new minimum of about 35mm.✔[1 mark]

Ymateb awgrymedig

Gwelwyd y dyodiad mwyaf, sef 215mm, yn y flwyddyn gyntaf, 1928.✔[1 marc] Yn gyffredinol, mae'r dyodiad yn parhau i amrywio heb unrhyw batrwm gwirioneddol, gan aros uwchlaw 60mm ond islaw 150mm ar gyfer pob blwyddyn heblaw pump.✔[1 marc] Ond, yn y flwyddyn olaf, sef 1962, mae'n gostwng i isafswm newydd o tua 35mm.✔[1 marc]

Mnemonic

Some teachers and schools encourage students to use a mnemonic when analysing a pattern or distribution: each letter of a word serves as a reminder of an analytical point that must be made.

Cofeiriau

Mae rhai athrawon ac ysgolion yn annog myfyrwyr i ddefnyddio cofeiriau i ddadansoddi patrwm neu ddosbarthiad: mae pob llythyr mewn gair yn eu hatgoffa o bwynt dadansoddol y mae'n rhaid ei wneud.

One example is the OPPAD mnemonic.

Take every opportunity to practice analysing patterns shown on maps during your course.

You can apply the OPPAD mnemonic to maps in your text books, for example, and practice writing your own (maximum) 100-word analysis of what you can see.

O ✔ interpret the Overall picture or story shown (is it even or very uneven?)
P ✔ analyse the Pattern, if one is present (is there clustering, or is a more scattered or random distribution shown?)
P ✔ identify Place names worthy of special mention (e.g. the distribution may be clustered in a certain region)
A ✔ identify Anomalies or map features which do not conform well with the general pattern (for example, volcanic hotspots on a world map of volcanic activity)
D ✔ use Data in the answer (if the map has a scale then it is possible to estimate the length of a linear distribution of settlements, for example)

Un enghraifft yw'r cofair Saesneg OPPAD (Overall, Pattern, Place, Anomalies, Data).

Achubwch ar bob cyfle i ymarfer dadansoddi patrymau a ddangosir ar fapiau yn ystod eich cwrs.

Gallwch ddefnyddio'r cofair OPPAD mewn perthynas â mapiau yn eich gwerslyfrau, er enghraifft, ac ymarfer ysgrifennu eich dadansoddiad eich hun (uchafswm o 100 o eiriau) o'r hyn y gallwch ei weld.

O ✔ dehongli'r stori neu'r darlun cyffredinol a ddangosir (a yw'n gyson neu'n anghyson iawn?)
P ✔ dadansoddi'r patrwm, os o gwbl, (a oes clystyru, neu ddosbarthiad mwy gwasgaredig neu ddosbarthiad ar hap?)
P ✔ nodi enwau lleoedd y mae'n werth sôn amdanynt (e.e. efallai fod y dosbarthiad wedi'i glystyru mewn rhanbarth penodol)
A ✔ nodi anomaleddau neu nodweddion ar fap nad ydynt yn cydymffurfio'n agos â'r patrwm cyffredinol (er enghraifft, mannau folcanig ar fap o'r byd sy'n nodi gweithgarwch folcanig)
D ✔ defnyddio data yn yr ateb (os yw'r map yn cynnwys graddfa yna mae'n bosibl amcangyfrif hyd dosbarthiad llinol aneddiadau, er enghraifft)