| Labour | Land | Capital | Enterprise | |
|---|---|---|---|---|
| Quantity | ||||
| Quality | ||||
| Efficiency of use |
Task 1 - Use the pen tool to adapt the AS function below to show the effects of the changes you have identified (Think about PPFs):
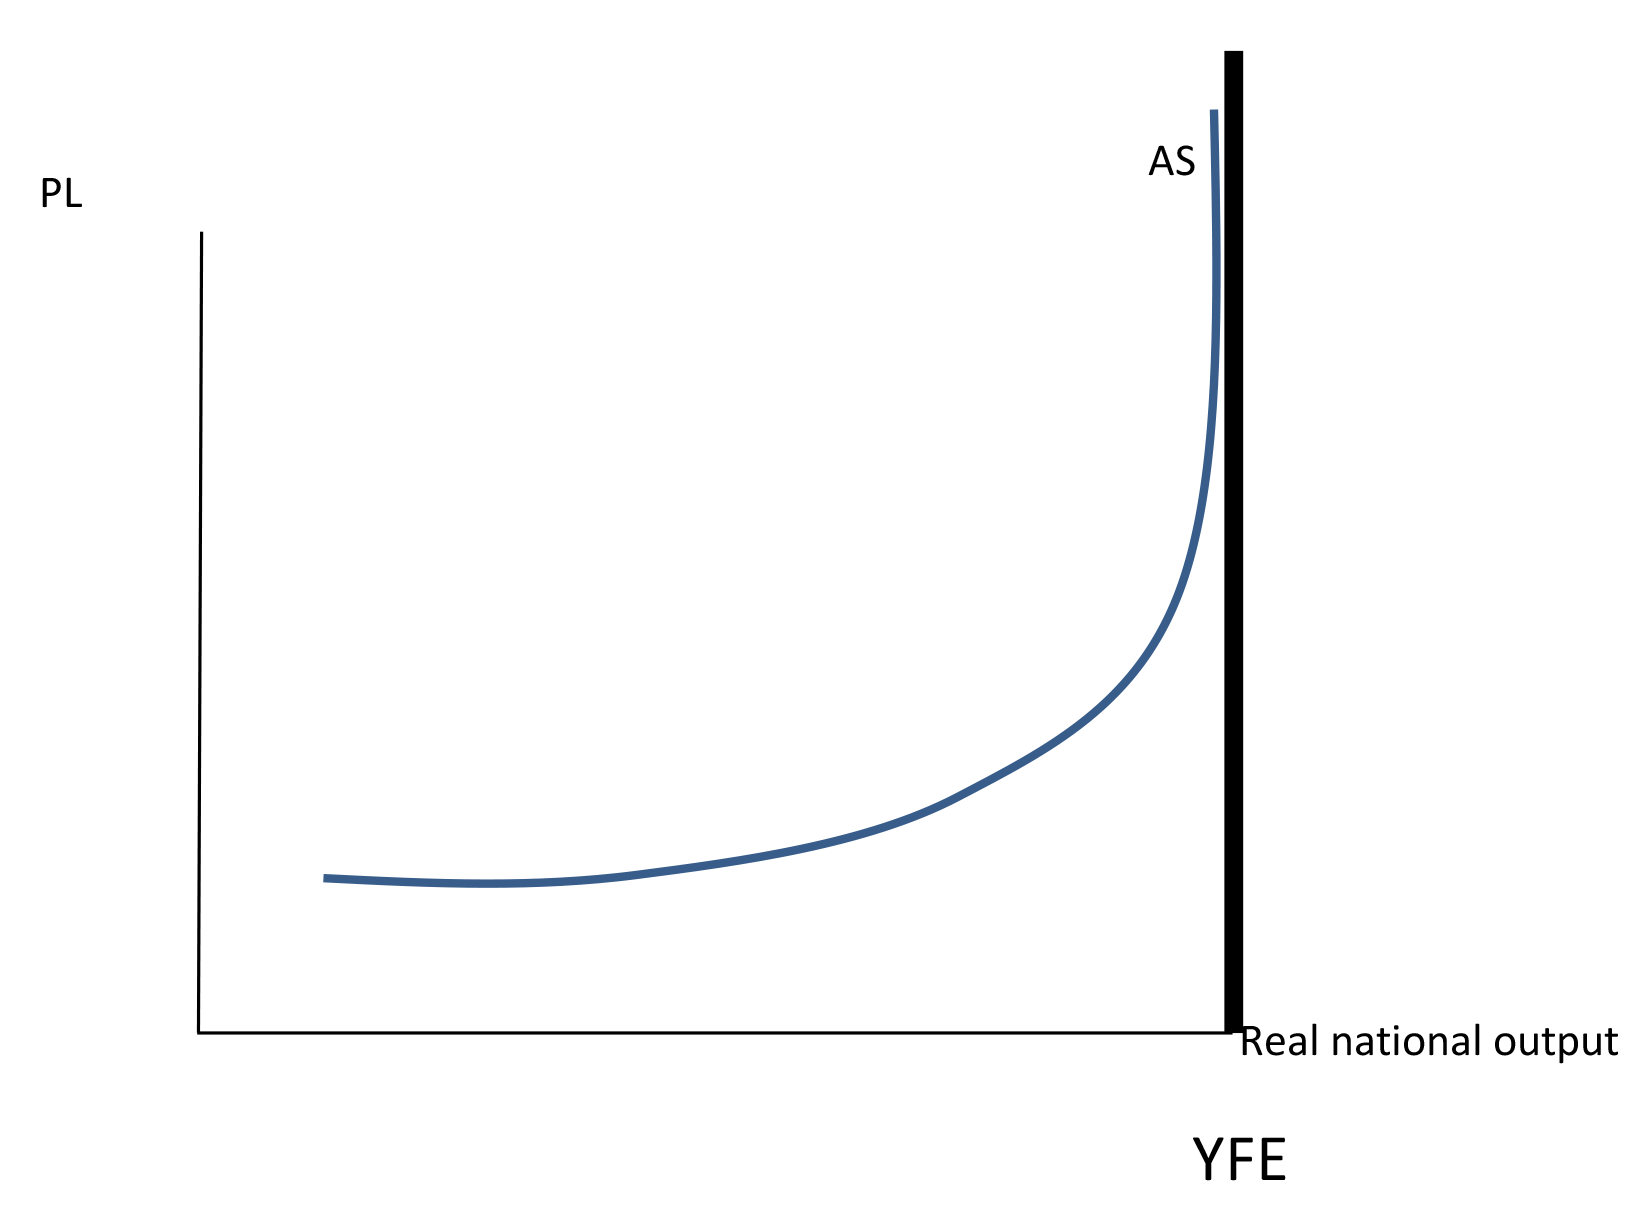
Write a paragraph explaining what is happening?
Task 2 - Another way AS could shift could be something happening to costs in the economy: Costs could increase as a result of an increase in oil prices, or VAT or wages. How might we show this on an AS diagram?
Think about: Will the capacity be affected by this? Has anything happened to the potential of the economy if costs go up, or will it mainly affect the cost of producing a given level of output? How will we show this?
Adapt the diagram and write a paragraph explaining what is happening.
Adapt the diagram and write a paragraph explaining what is happening.
Task 3 - Alternatively costs might fall. Show this (e.g. the cut in VAT shortly after the recession began back in 2008)
Adapt the diagram and write a paragraph explaining what is happening.