Toggle navigation
Consumption exercise
clear all
erase
hide
×
Information
Please read the teacher guidance printable resource for activity instructions and suggested prompts.
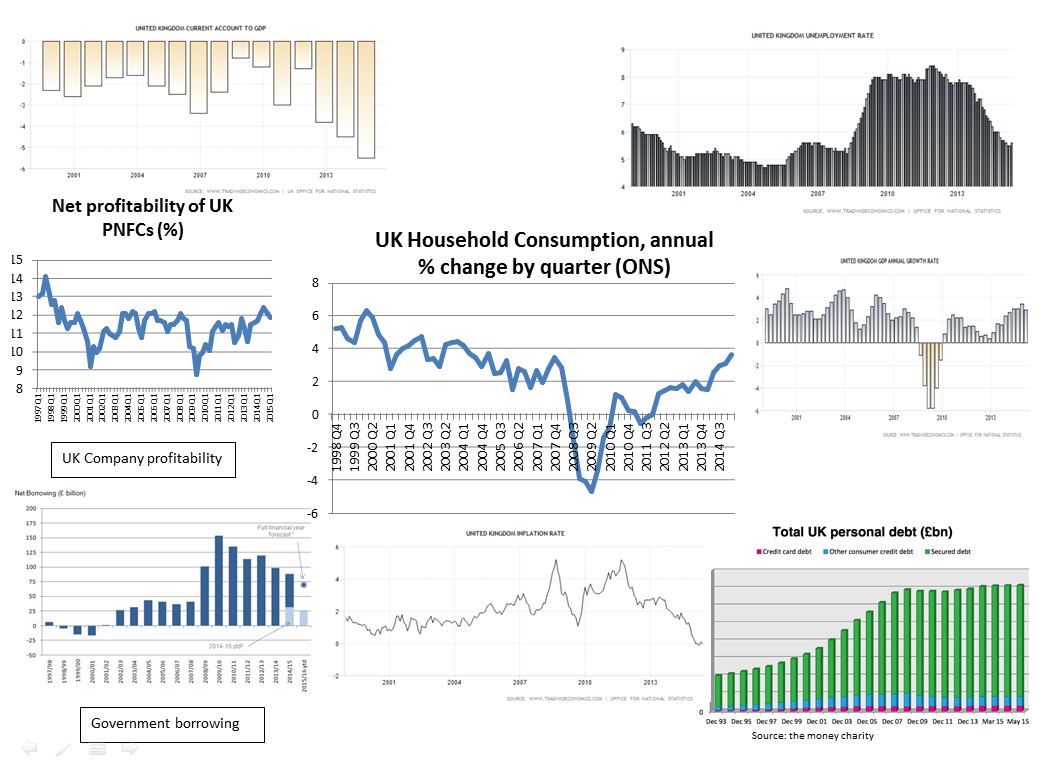
Look at this graphic and then use the data to answer the following questions.
What are the links between changes in consumption and each of the other graphs? Which links seem to be the strongest?
In each case, why do you think this is?
Overall, how important does consumption seem to be?
Prompt question