The aim here is to try to work out why the prices of agricultural and other primary goods are so volatile. Start by showing this chart, looking over a 20–30 year period.
Divide the students into pairs and ask them to come up with possible reasons for this variation. They will probably come up with supply volatility, a few might also think about low PED and PES.

Source URL: 'www.indexmundi.com'
Show the students the following clips. After each one, ask them to draw (in pairs) a supply and demand diagram trying to explain what they think might be going on. Please refer to the pdf on Price Volatility.
Click on an image to open a video in a new window.
Coffee
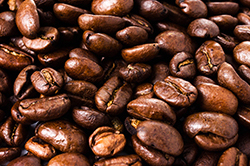
Source URL: 'BBC News'
Orange juice
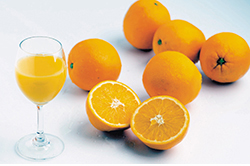
Source URL: 'www.bloomberg.com'
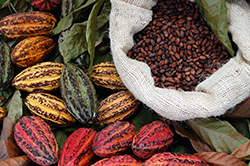
Chocfinger