In this exercise, the students are going to work out the difference between movements along and shifts in a demand curve using some real world scenarios. Work out which graph describes the scenario and click on it. Once you have chosen a graph for all four scenarios you will be shown if you have the correct answer.
Which graph describes the scenario?
Xbox One orders SURGE at GameStop after $100 price drop

"I definitely think we're already seeing in our stores – with our reservation program as well as dialogue with PowerUp Rewards members – that there's a stronger demand as a result of the price drop," Bartel, CEO of GameStop claimed. "The good news for us is ... we'll sell a lot more units."


Which graph describes the scenario?
Demand for gold plummets following last year's rush and ongoing Chinese corruption crackdown

Last year's second quarter gold rush has been followed by a slump in demand, most heavily felt in China where consumers spent 55% less on jewellery, gold bars and coins than the same time in 2013.
Some of this decline comes on the back of the major clampdown on corruption in China following a series of scandals involving politicians and business leaders, which has already affected sales of big ticket items such as cars and watches.
Which graph describes the scenario?
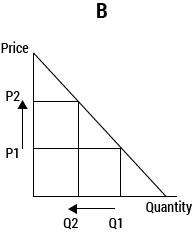
Japan auto demand to slump after sales tax hike

TOKYO (Bloomberg) – Japanese auto deliveries will drop 16% in the year starting April 1 as a sales-tax increase damps demand, an industry group estimates.
Sales will probably fall to 4.75 million units in Japan, the world's third-largest auto market, as the levy rises to 8% from the current 5%, increasing the price to consumers.
Which graph describes the scenario?
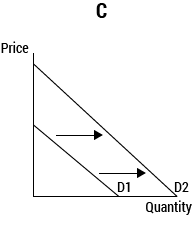
Huge surge in rail journeys since the 1990s

New figures show that the number of rail journeys taken in a single year has more than doubled since the 1990s, as workers commute greater distances and road networks are increasingly congested.
In total, 1.27 billion trips were made across England, Scotland and Wales in the 12 months leading up to March 2013, the Office of Rail Regulation said. That figure increased by 3.3% between 2012 and 2013 and compares to 589.5 million journeys in 1995/96.
Results
Question 1
Question 2
Question 3
Question 4